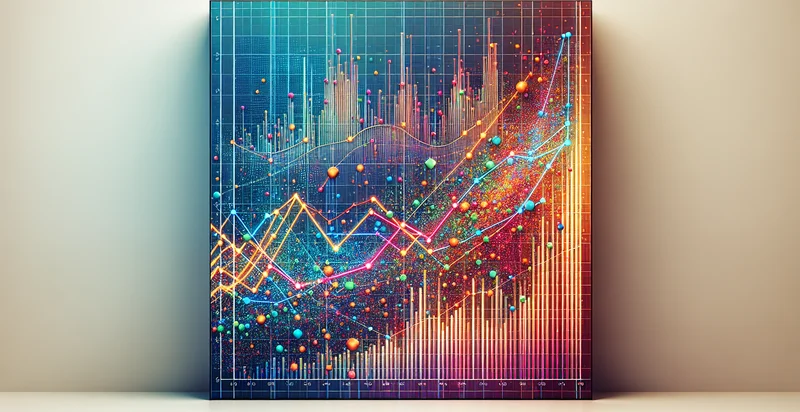
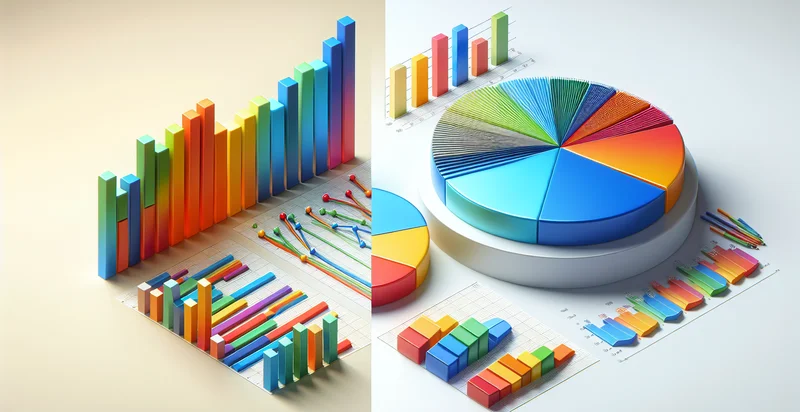
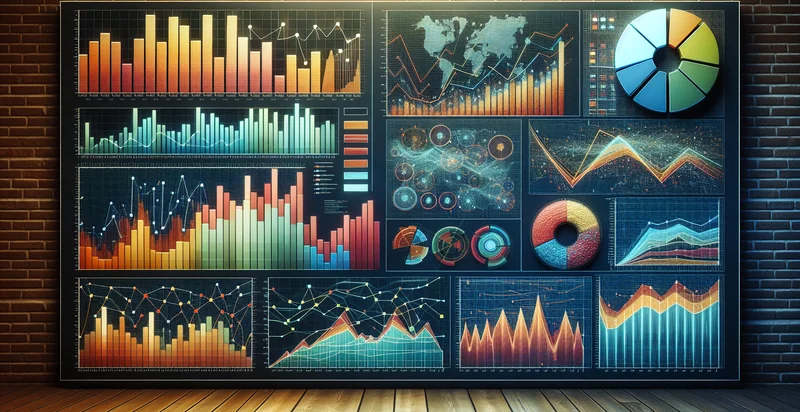
Identify line graphs vs scatter plots
using AI
Below is a free classifier to identify line graphs vs scatter plots. Just upload your image, and our AI will predict if it is a line graph or a scatter plot - in just seconds.

Contact us for API access
Or, use Nyckel to build highly-accurate custom classifiers in just minutes. No PhD required.
Get started
    import nyckel

    credentials = nyckel.Credentials("YOUR_CLIENT_ID", "YOUR_CLIENT_SECRET")
    nyckel.invoke("line-graphs-vs-scatter-plots-identifier", "your_image_url", credentials)
    fetch('https://www.nyckel.com/v1/functions/line-graphs-vs-scatter-plots-identifier/invoke', {
        method: 'POST',
        headers: {
            'Authorization': 'Bearer ' + 'YOUR_BEARER_TOKEN',
            'Content-Type': 'application/json',
        },
        body: JSON.stringify(
            {"data": "your_image_url"}
        )
    })
    .then(response => response.json())
    .then(data => console.log(data));
    curl -X POST \
        -H "Content-Type: application/json" \
        -H "Authorization: Bearer YOUR_BEARER_TOKEN" \
        -d '{"data": "your_image_url"}' \
        https://www.nyckel.com/v1/functions/line-graphs-vs-scatter-plots-identifier/invoke
How this classifier works
To start, upload your image. Our AI tool will then predict if it is a line graph or a scatter plot.
This pretrained image model uses a Nyckel-created dataset and has 2 labels, including Line Graphs and Scatter Plots.
We'll also show a confidence score (the higher the number, the more confident the AI model is around if it is a line graph or a scatter plot).
Whether you're just curious or building line graphs vs scatter plots detection into your application, we hope our classifier proves helpful.
Related Classifiers
Need to identify line graphs vs scatter plots at scale?
Get API or Zapier access to this classifier for free. It's perfect for:
- Data Visualization Tool Optimization: This function can be integrated into data visualization software to automatically suggest the most appropriate graph type (line graph or scatter plot) based on the nature of the data provided by the user. By identifying existing graphs and improving their representation, users can enhance the clarity and effectiveness of their presentations.
- Automated Report Generation: In business intelligence applications, the binary classifier can analyze datasets and decide whether to generate line graphs or scatter plots for reports. This automation reduces the manual effort involved in determining the best visual representation, allowing analysts to focus more on insights and conclusions.
- Educational Software Development: Educational platforms can utilize this function to teach students about different data visualization techniques. By automatically categorizing provided examples as either line graphs or scatter plots, learners can receive instant feedback and improve their understanding of when to use each type effectively.
- Marketing Analytics Dashboard: Marketing teams can implement this classifier in their analytical dashboards to dynamically adjust visualizations based on the metrics being analyzed. This ensures that stakeholders receive the clearest and most relevant representations of trends, correlations, and potential outliers in marketing data.
- User Behavior Analytics: E-commerce platforms can leverage this function to assess user interaction data and choose between line graphs and scatter plots for visualizations. By doing so, they can better illustrate trends in user behavior over time or the relationship between different metrics, thereby aiding in strategic decision-making.
- Research Data Analysis: Researchers can apply this binary classification function to improve the presentation of their findings by selecting the most suitable graph type for their datasets. This value-added service helps in enhancing the communication of research outcomes, making them more accessible to a broader audience.
- Financial Reporting Tools: Financial software can integrate this function to better visualize time-series data (line graphs) versus transactional data (scatter plots). This helps analysts quickly determine the most effective way to represent financial trends and anomalies, facilitating clearer communication of important financial metrics.


