Identify chart types
using AI
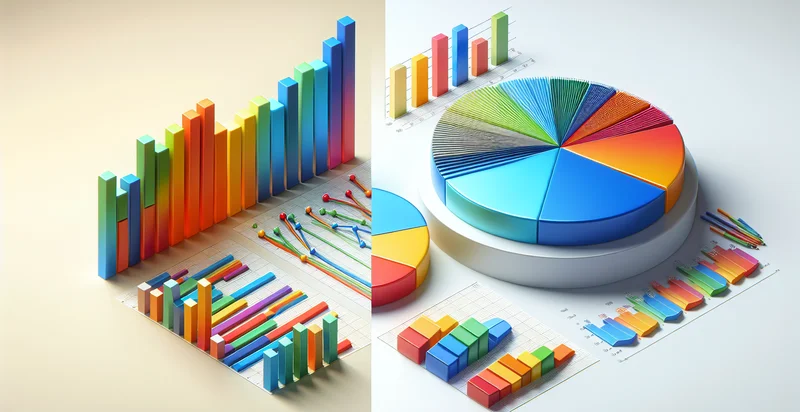
Below is a free classifier to identify chart types. Just upload your image, and our AI will predict what type of chart it is - in just seconds.

Contact us for API access
Or, use Nyckel to build highly-accurate custom classifiers in just minutes. No PhD required.
Get started
    import nyckel

    credentials = nyckel.Credentials("YOUR_CLIENT_ID", "YOUR_CLIENT_SECRET")
    nyckel.invoke("chart-types-identifier", "your_image_url", credentials)
    fetch('https://www.nyckel.com/v1/functions/chart-types-identifier/invoke', {
        method: 'POST',
        headers: {
            'Authorization': 'Bearer ' + 'YOUR_BEARER_TOKEN',
            'Content-Type': 'application/json',
        },
        body: JSON.stringify(
            {"data": "your_image_url"}
        )
    })
    .then(response => response.json())
    .then(data => console.log(data));
    curl -X POST \
        -H "Content-Type: application/json" \
        -H "Authorization: Bearer YOUR_BEARER_TOKEN" \
        -d '{"data": "your_image_url"}' \
        https://www.nyckel.com/v1/functions/chart-types-identifier/invoke
How this classifier works
To start, upload your image. Our AI tool will then predict what type of chart it is.
This pretrained image model uses a Nyckel-created dataset and has 20 labels, including Bar Chart and Line Chart.
We'll also show a confidence score (the higher the number, the more confident the AI model is around what type of chart it is).
Whether you're just curious or building chart types detection into your application, we hope our classifier proves helpful.
Related Classifiers


Need to identify chart types at scale?
Get API or Zapier access to this classifier for free. It's perfect for:
- Data Visualization Tool Enhancement: Integrating the multilabel image classification function in data visualization tools can help users automatically identify and label different types of charts in documents or presentations. This enhances user experience by improving accessibility and searchability for specific chart types, enabling users to quickly evaluate data representation.
- Educational Content Assessment: Educational platforms can utilize this function to evaluate students' assignments or projects that include charts. By identifying the various chart types, the system can provide targeted feedback, ensuring students understand when to use specific visualization methods effectively.
- Market Research Analysis: Market research firms can leverage this function to analyze visual data in reports. By automatically classifying charts, firms can more easily summarize findings and generate insights on market trends or competitor analysis, leading to more informed decision-making.
- Automated Report Generation: Businesses can use this function within automated reporting systems to categorize and label visual data in generated reports. This streamlines the report creation process, ensuring clarity and consistency in how different data visuals are represented, ultimately enhancing stakeholder engagement.
- Quality Control in Visualization Creations: Design teams can implement this function to perform quality checks on data visuals created for marketing or presentations. By ensuring each chart is correctly identified, teams can avoid misrepresentations of data, maintaining a professional standard in visual communications.
- Social Media Analytics: Social media platforms and analytics tools can incorporate the classification function to categorize user-generated content featuring charts or infographics. This can help in evaluating engagement patterns and preferences, allowing marketers to tailor content strategies based on chart types and their effectiveness.
- User Behavior Analytics: Organizations can leverage the multilabel classification function to analyze user interactions with different chart types in their applications or websites. Understanding which types of charts attract more attention can guide design enhancements and improve user engagement with data presentations.